The following gives brief overview of the share of women on higher academic positions in Estonia compared to other EU countries as well as describes the problem of wage gap in Estonian academic institutions. It also gives light to the gender composition of mayor scientific decision making bodies in Estonia.
Dataset: HERE
Please refer to the sources (including Estonian Research Council).
5.1 Share of men and women researchers and engineers (FTE) in the public and private sectors (2022)
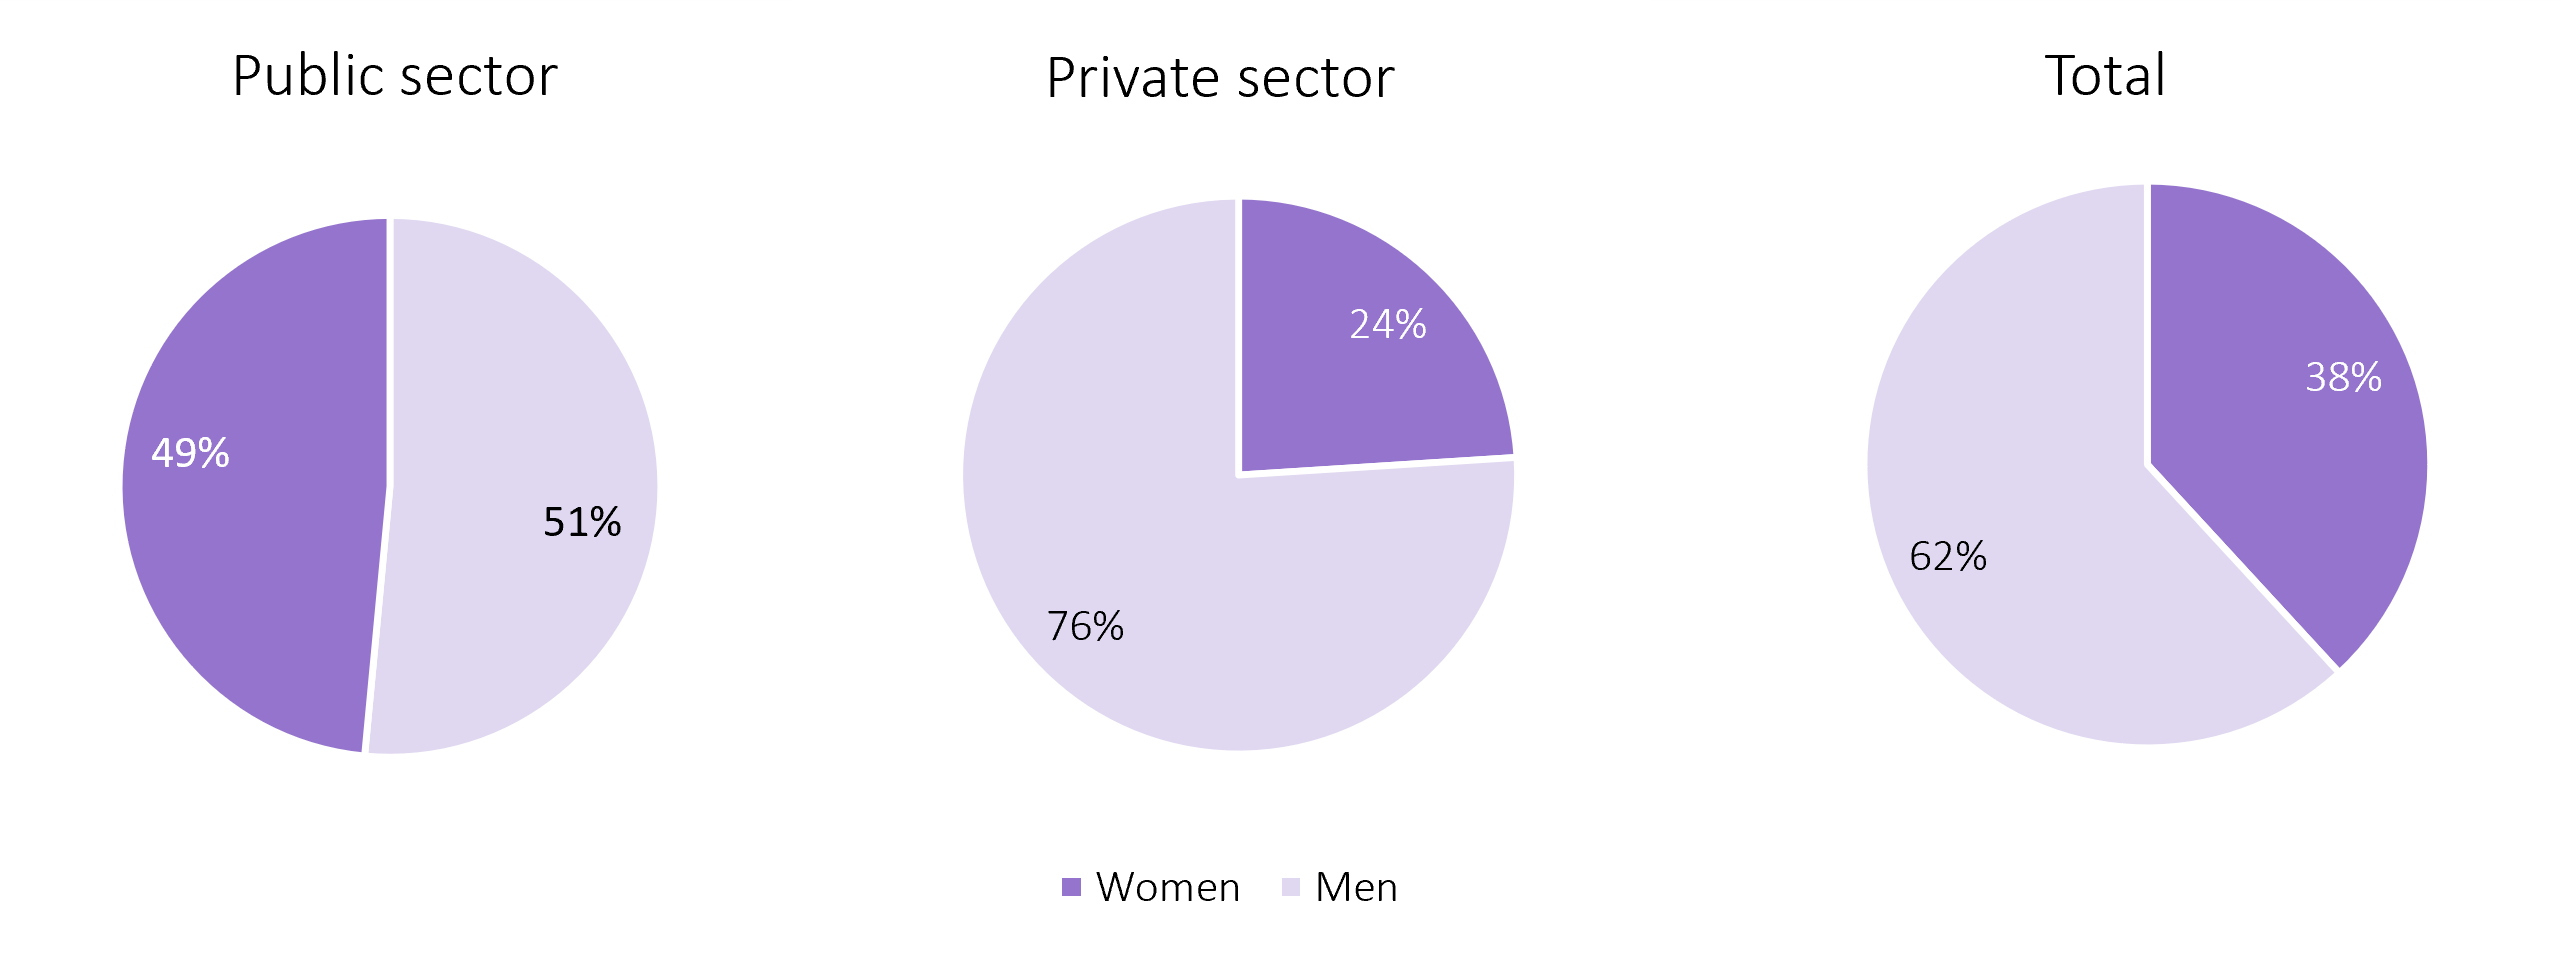
Source: Statistics Estonia (calculations by ETAG).
5.2 Share of men and women researchers and engineers (FTE) by field of research in the public sector (2022)
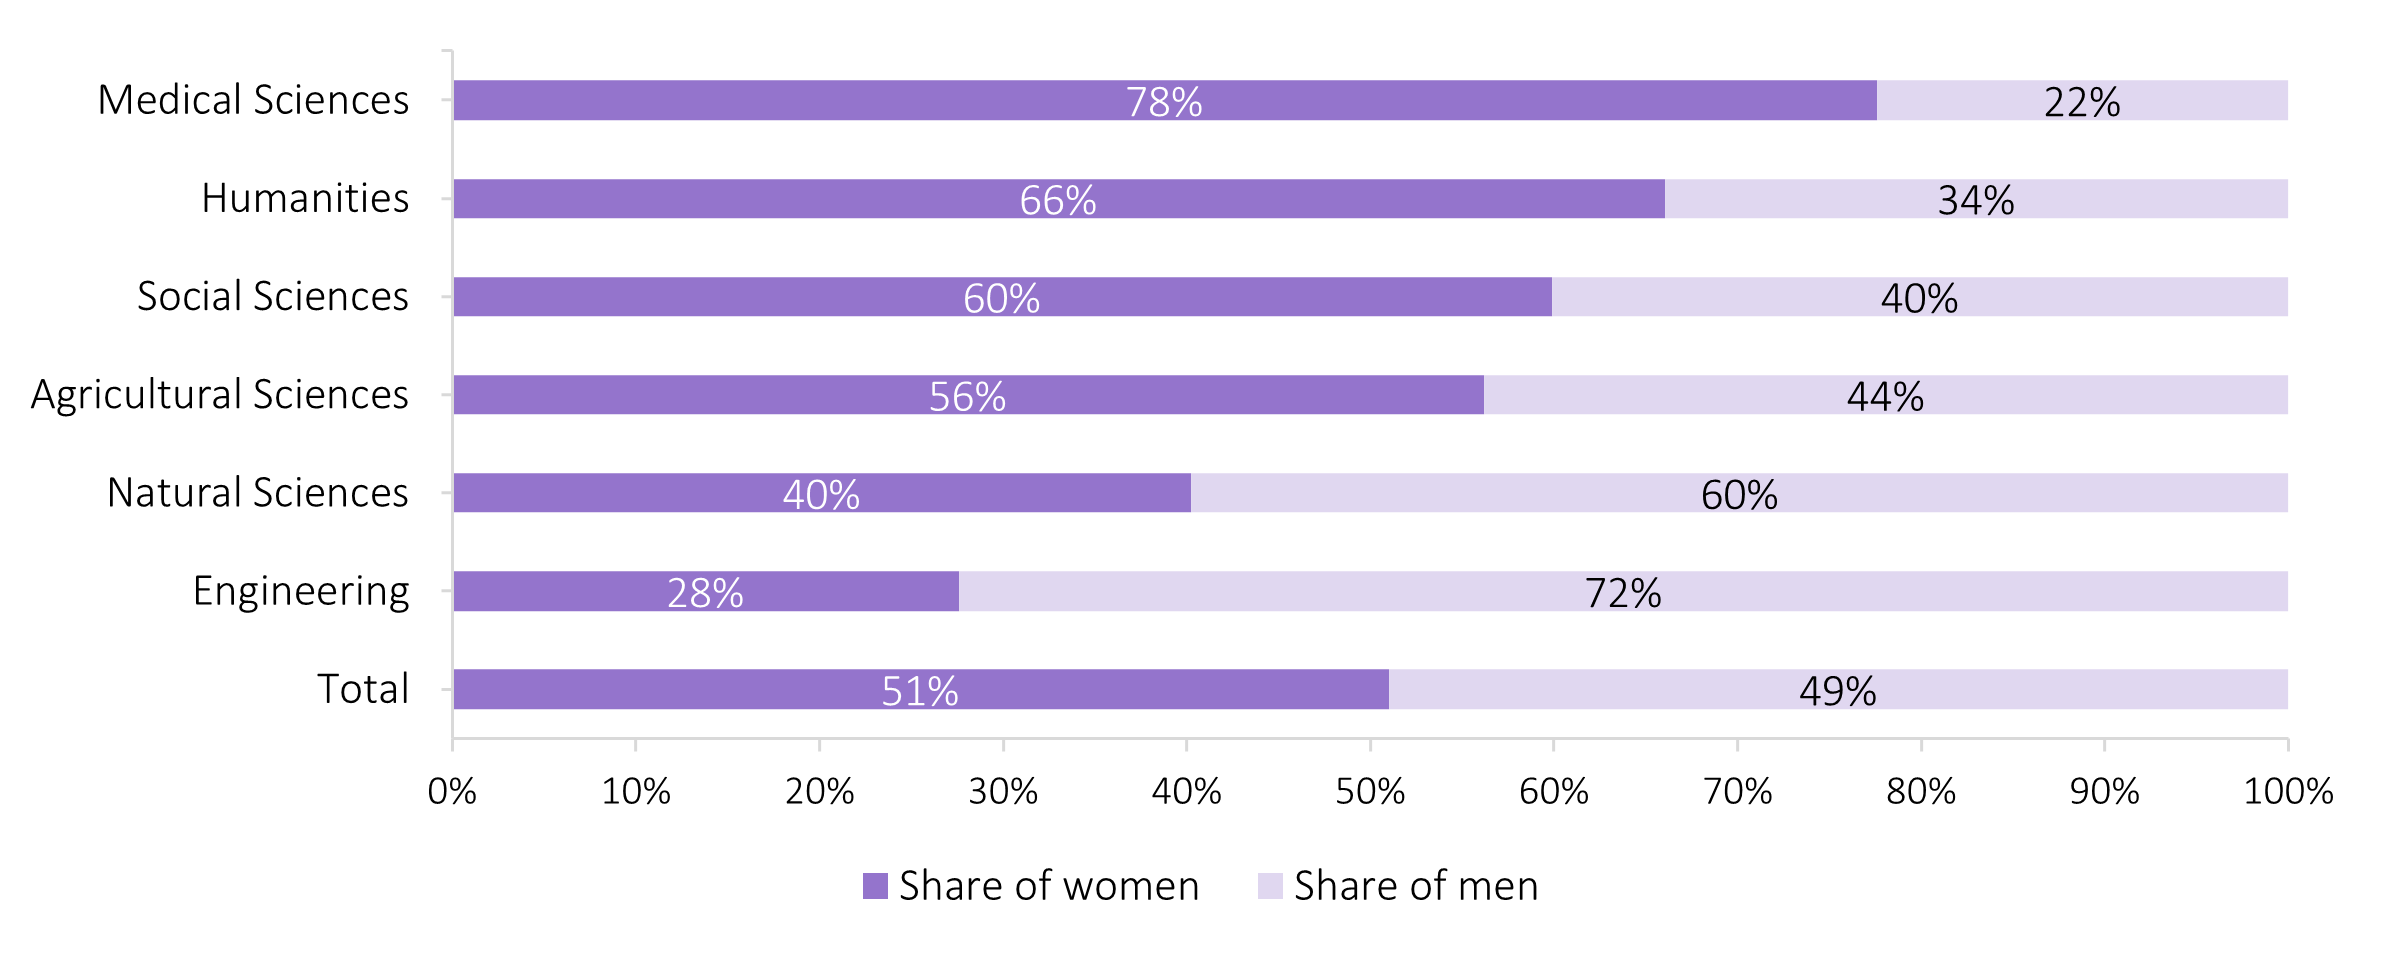
Source: Statistics Estonia (calculations by ETAG)
5.3 Share of women in Grade A positions in higher education (2015 and 2018)
Share of women in Grade A positions (professors) in higher education as a percentage of all such research positions is the headline indicator of European Research Area (ERA) 4th priority (gender equality and mainstreaming). This indicator is meant to assess the representation of women in the highest echelons of the research world (top-level academics)8.
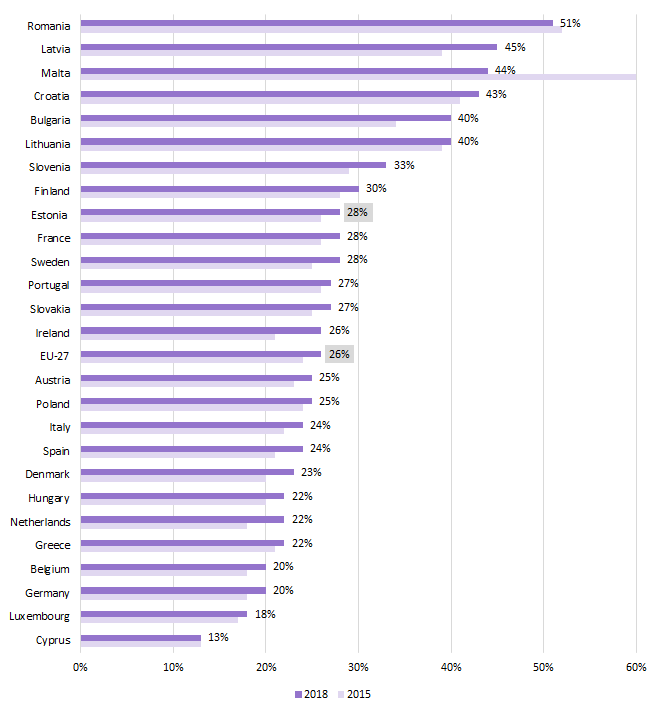
Sources: Universities Estonia (calculations by ETAG), She Figures Report (2021).
* The share of women among Estonian professors is based on the data of Universities Estonia, data on other countries is based on the European Commission’s report She Figures (2021).
The report is published every 3 years.
The methodology may vary.
5.4 Unadjusted gender pay gap in professional, scientific and technical activities (2021)
Gender pay gap on figure 1 represents the difference between average gross hourly earnings of men and women (as a percentage of average gross hourly earnings of men). The indicator is „unadjusted“, since it does not take into account the proportion of men and women in different positions. Thus, this indicator does not explain how much the wage gap was due to higher proportion of men working at positions generally having higher salaries and how much it was influenced by higher wages paid to men for the same work with his female colleague.
For economic activity classification NACE Rev.2 is used that is a common classification system in the EU.
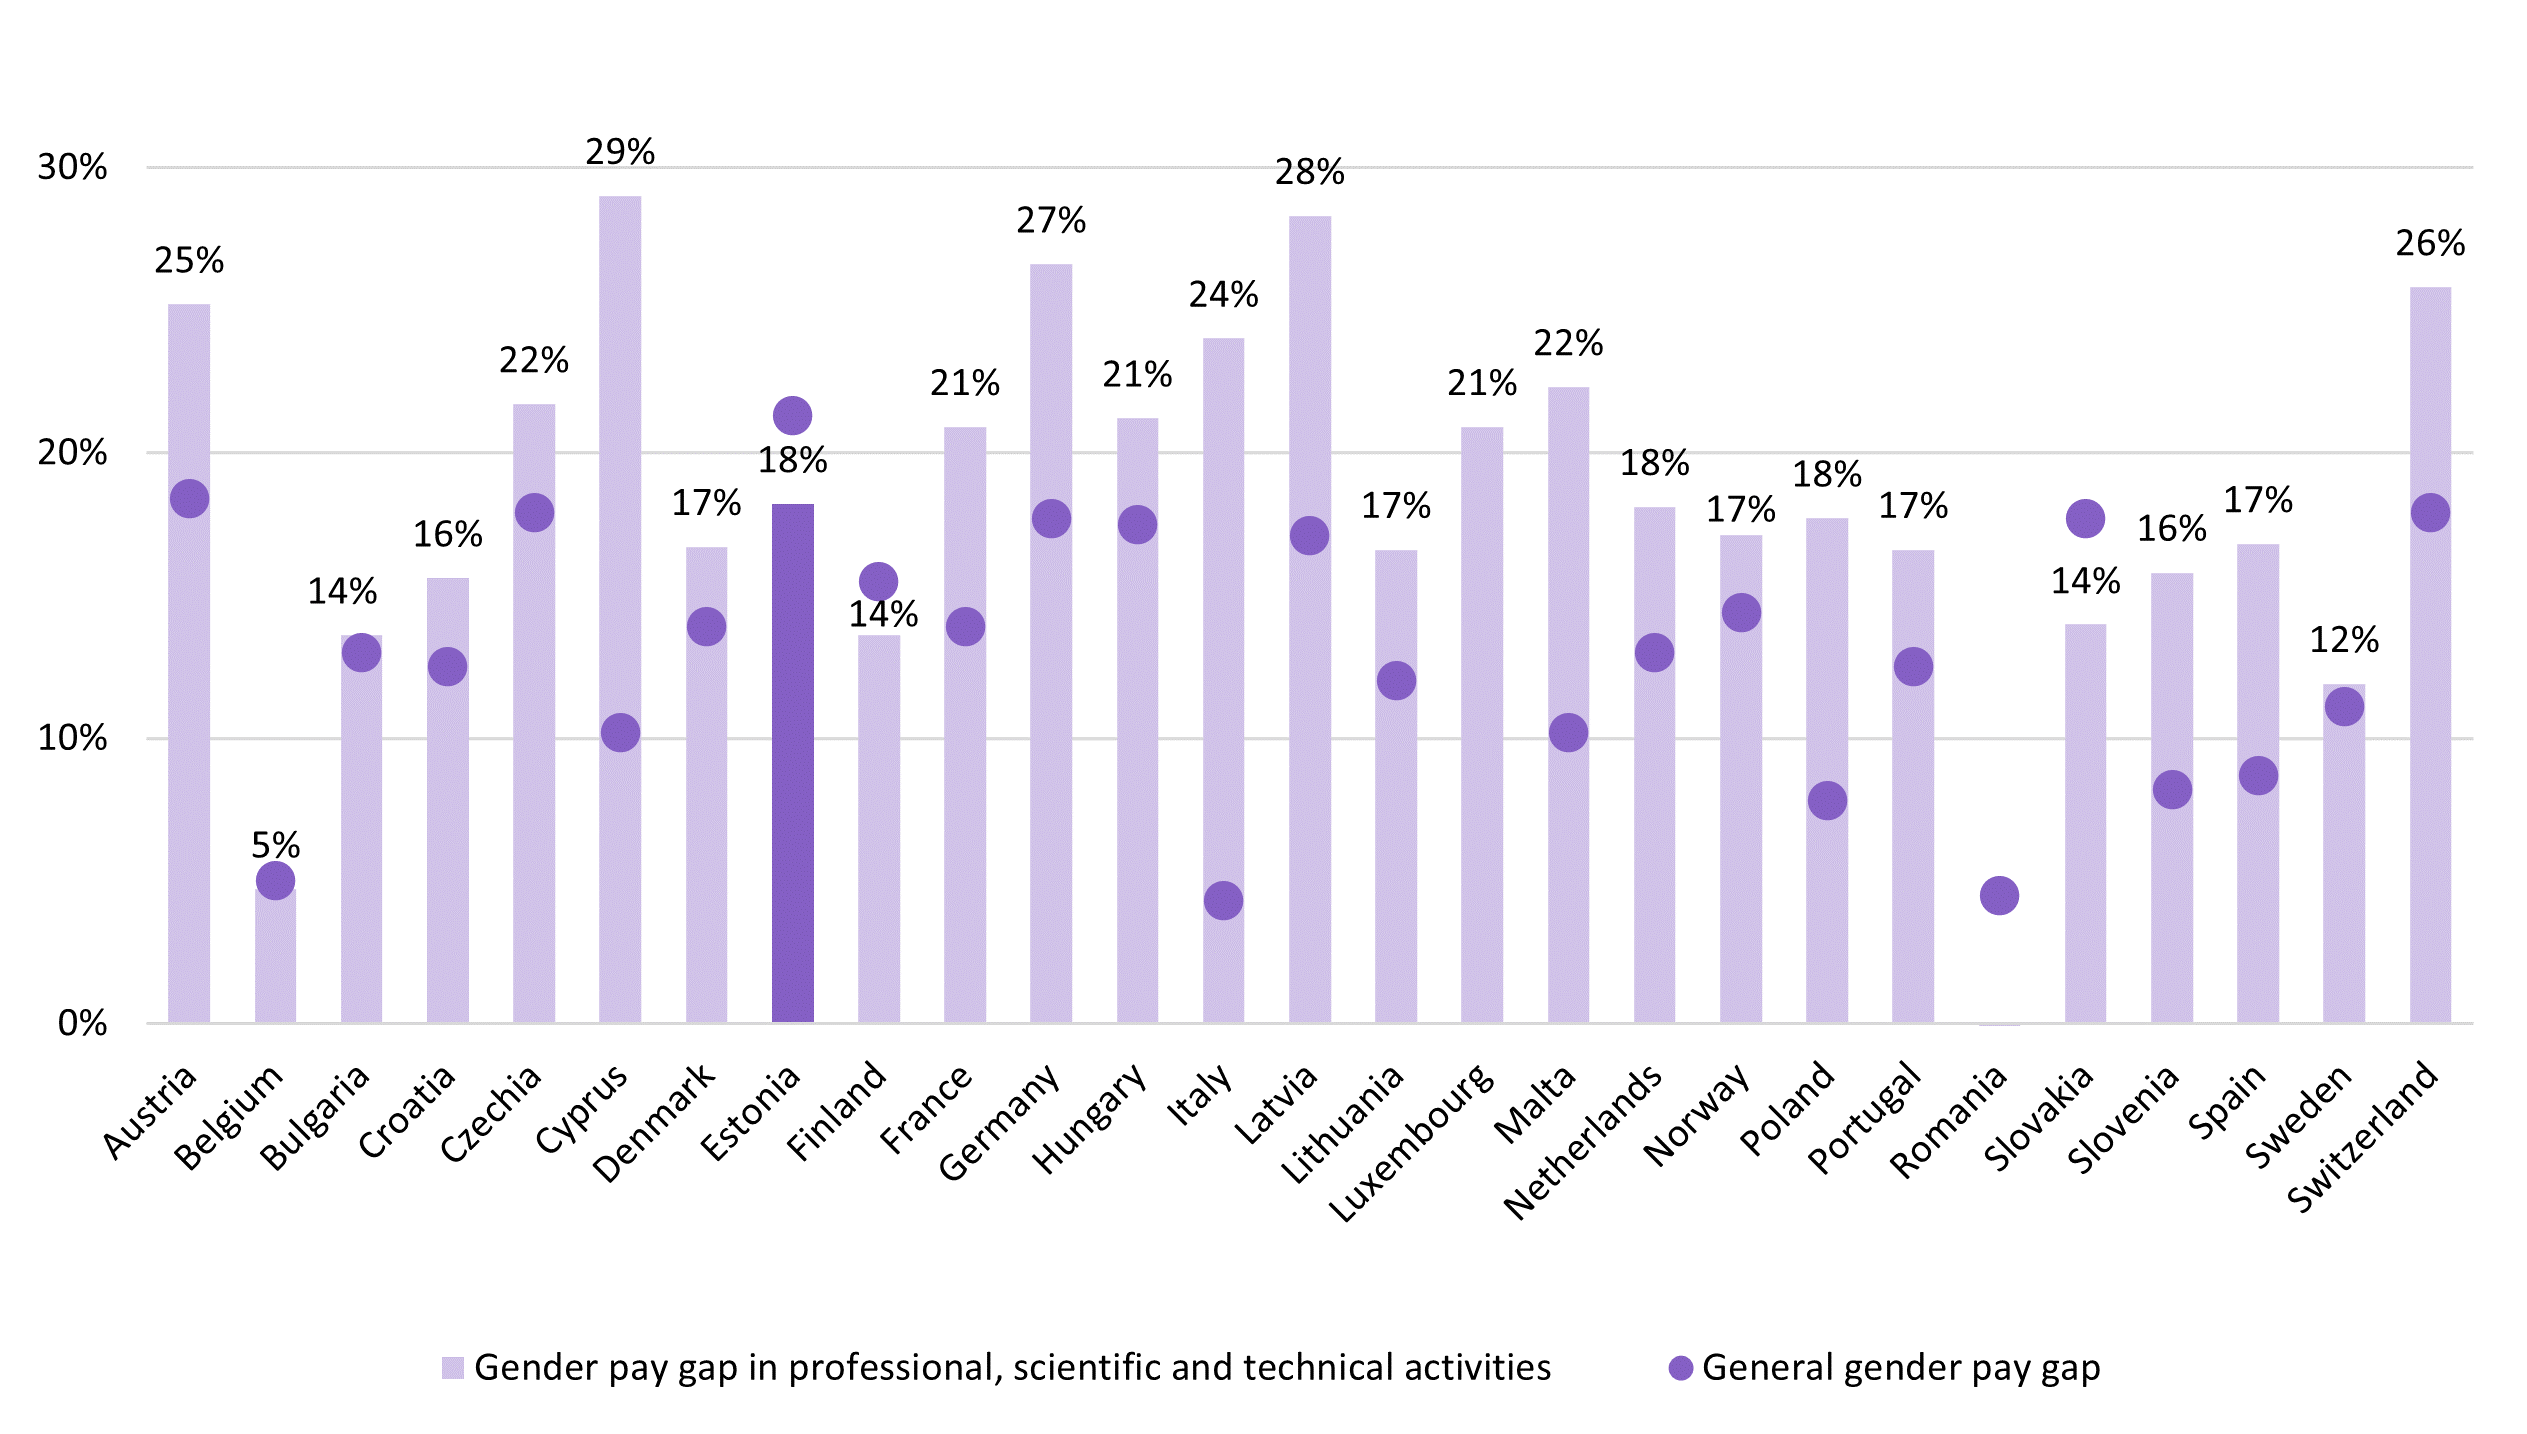
Source: Eurostat, 2022. Gender pay gap in unadjusted form, tables earn_gr_gpgr2 and sdg_05_20 (data last updated 24.05.2024).
5.5 Gender balance at scientific boards in Estonia
Balanced representation of men and women at scientific decesion making bodies is one of the prerequisites for addressing gender imbalances in research. In the EU research and innovation funding programme Horizon Europe, gender balance is a cross-cutting issue and achieved through three objectives of which one targets the gender balance in decision making bodies (40% of the under-represented sex in panels and groups and of 50% in advisory groups)9. The following is the overview of gender composition in three mayor scientific decision making bodies in Estonia: Research Policy Commitee, Research and Development Council, and Evaluation Commitee of the Estonian Research Council.
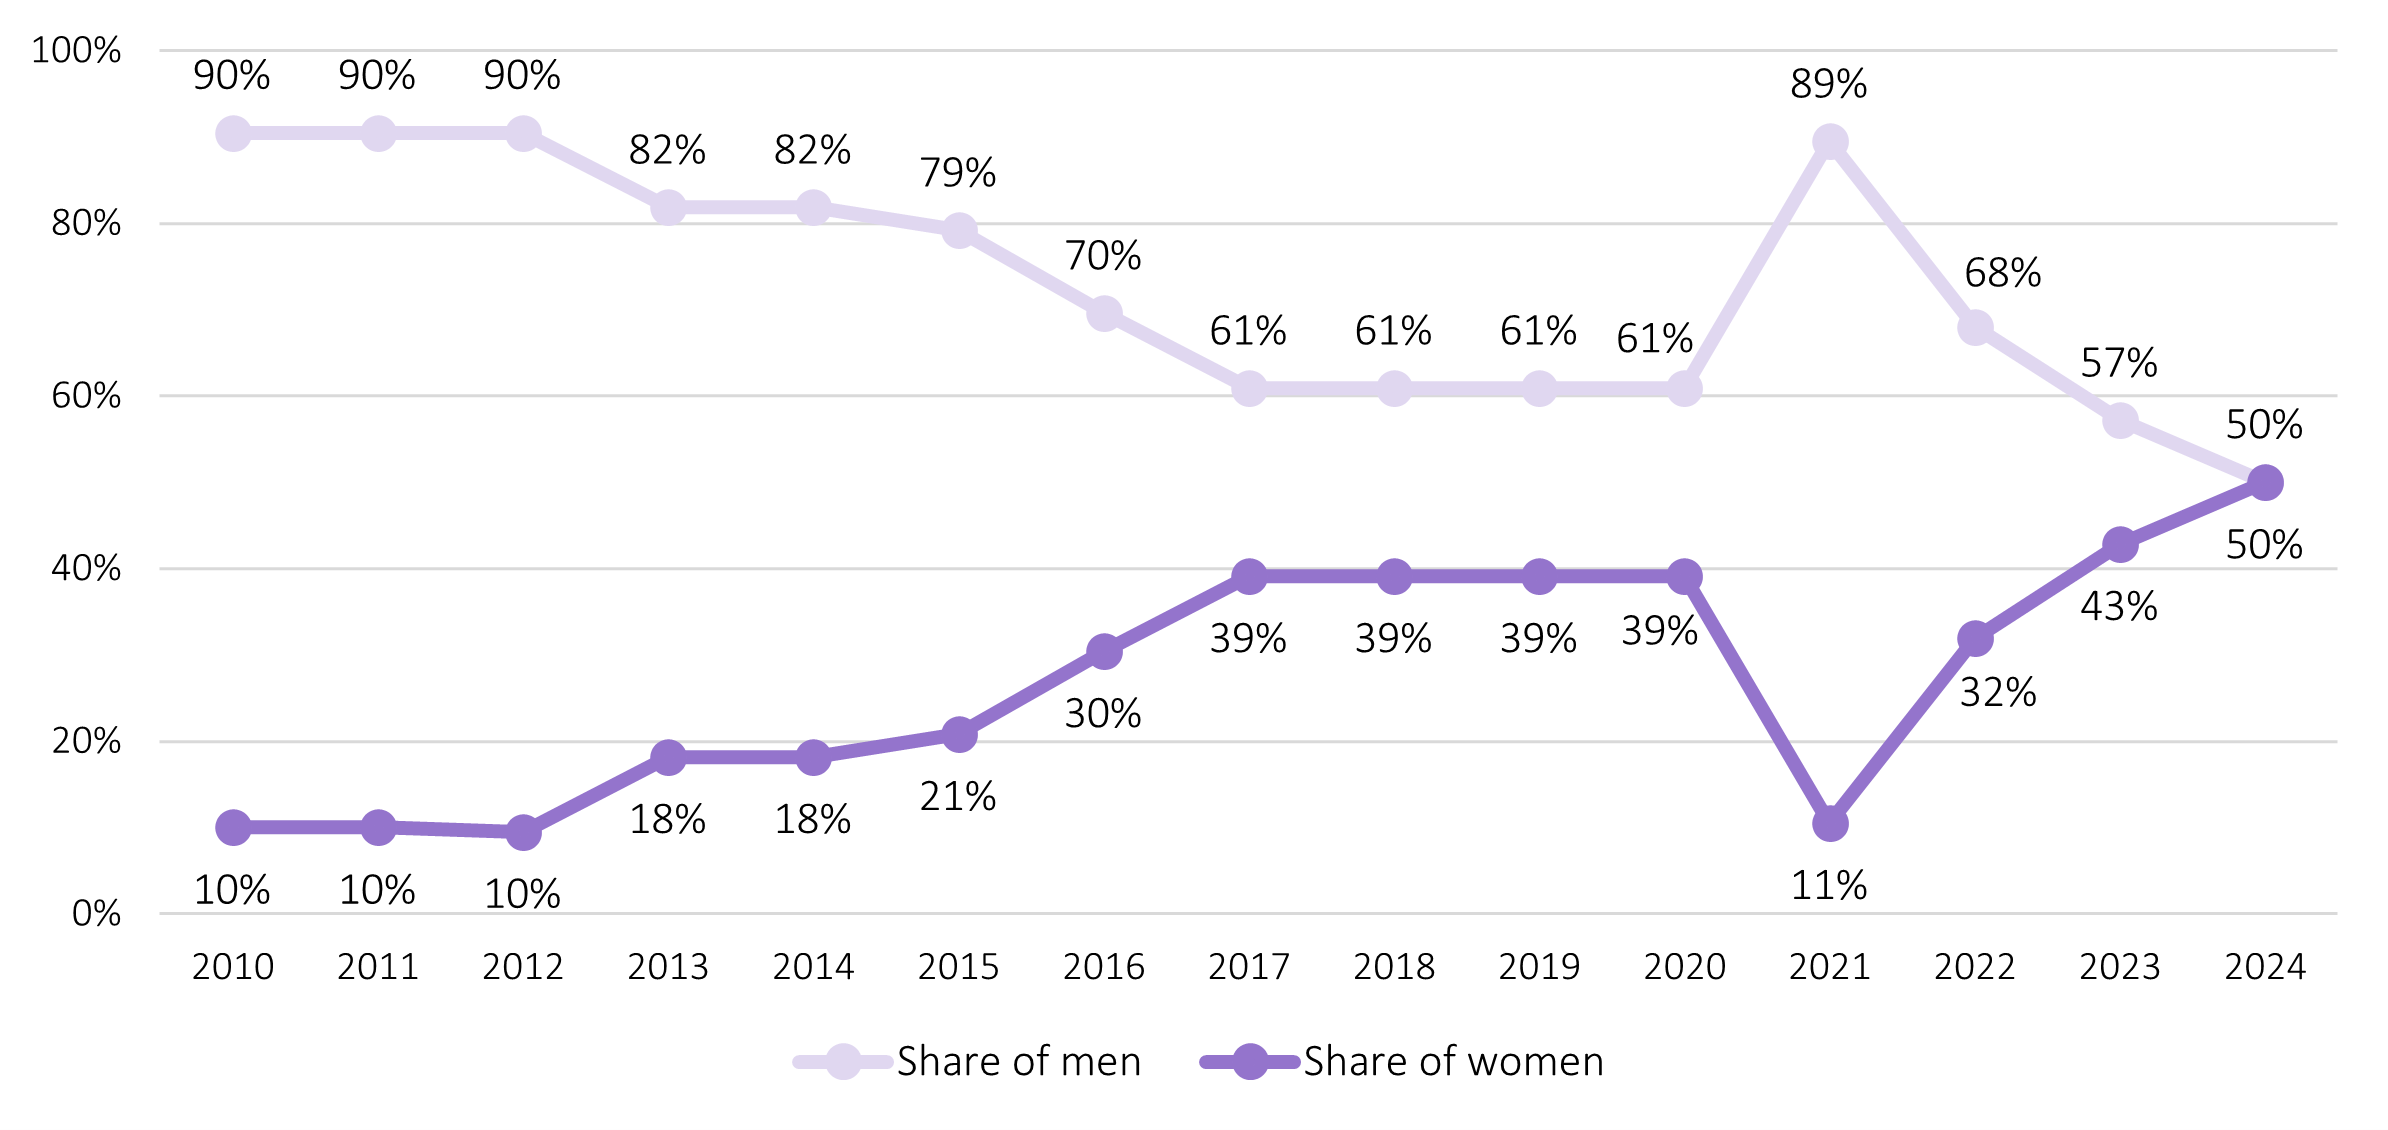
Members of Research Policy Committee by gender, 2010-2024.
Source: Riigi Teataja, calculations by ETAG.
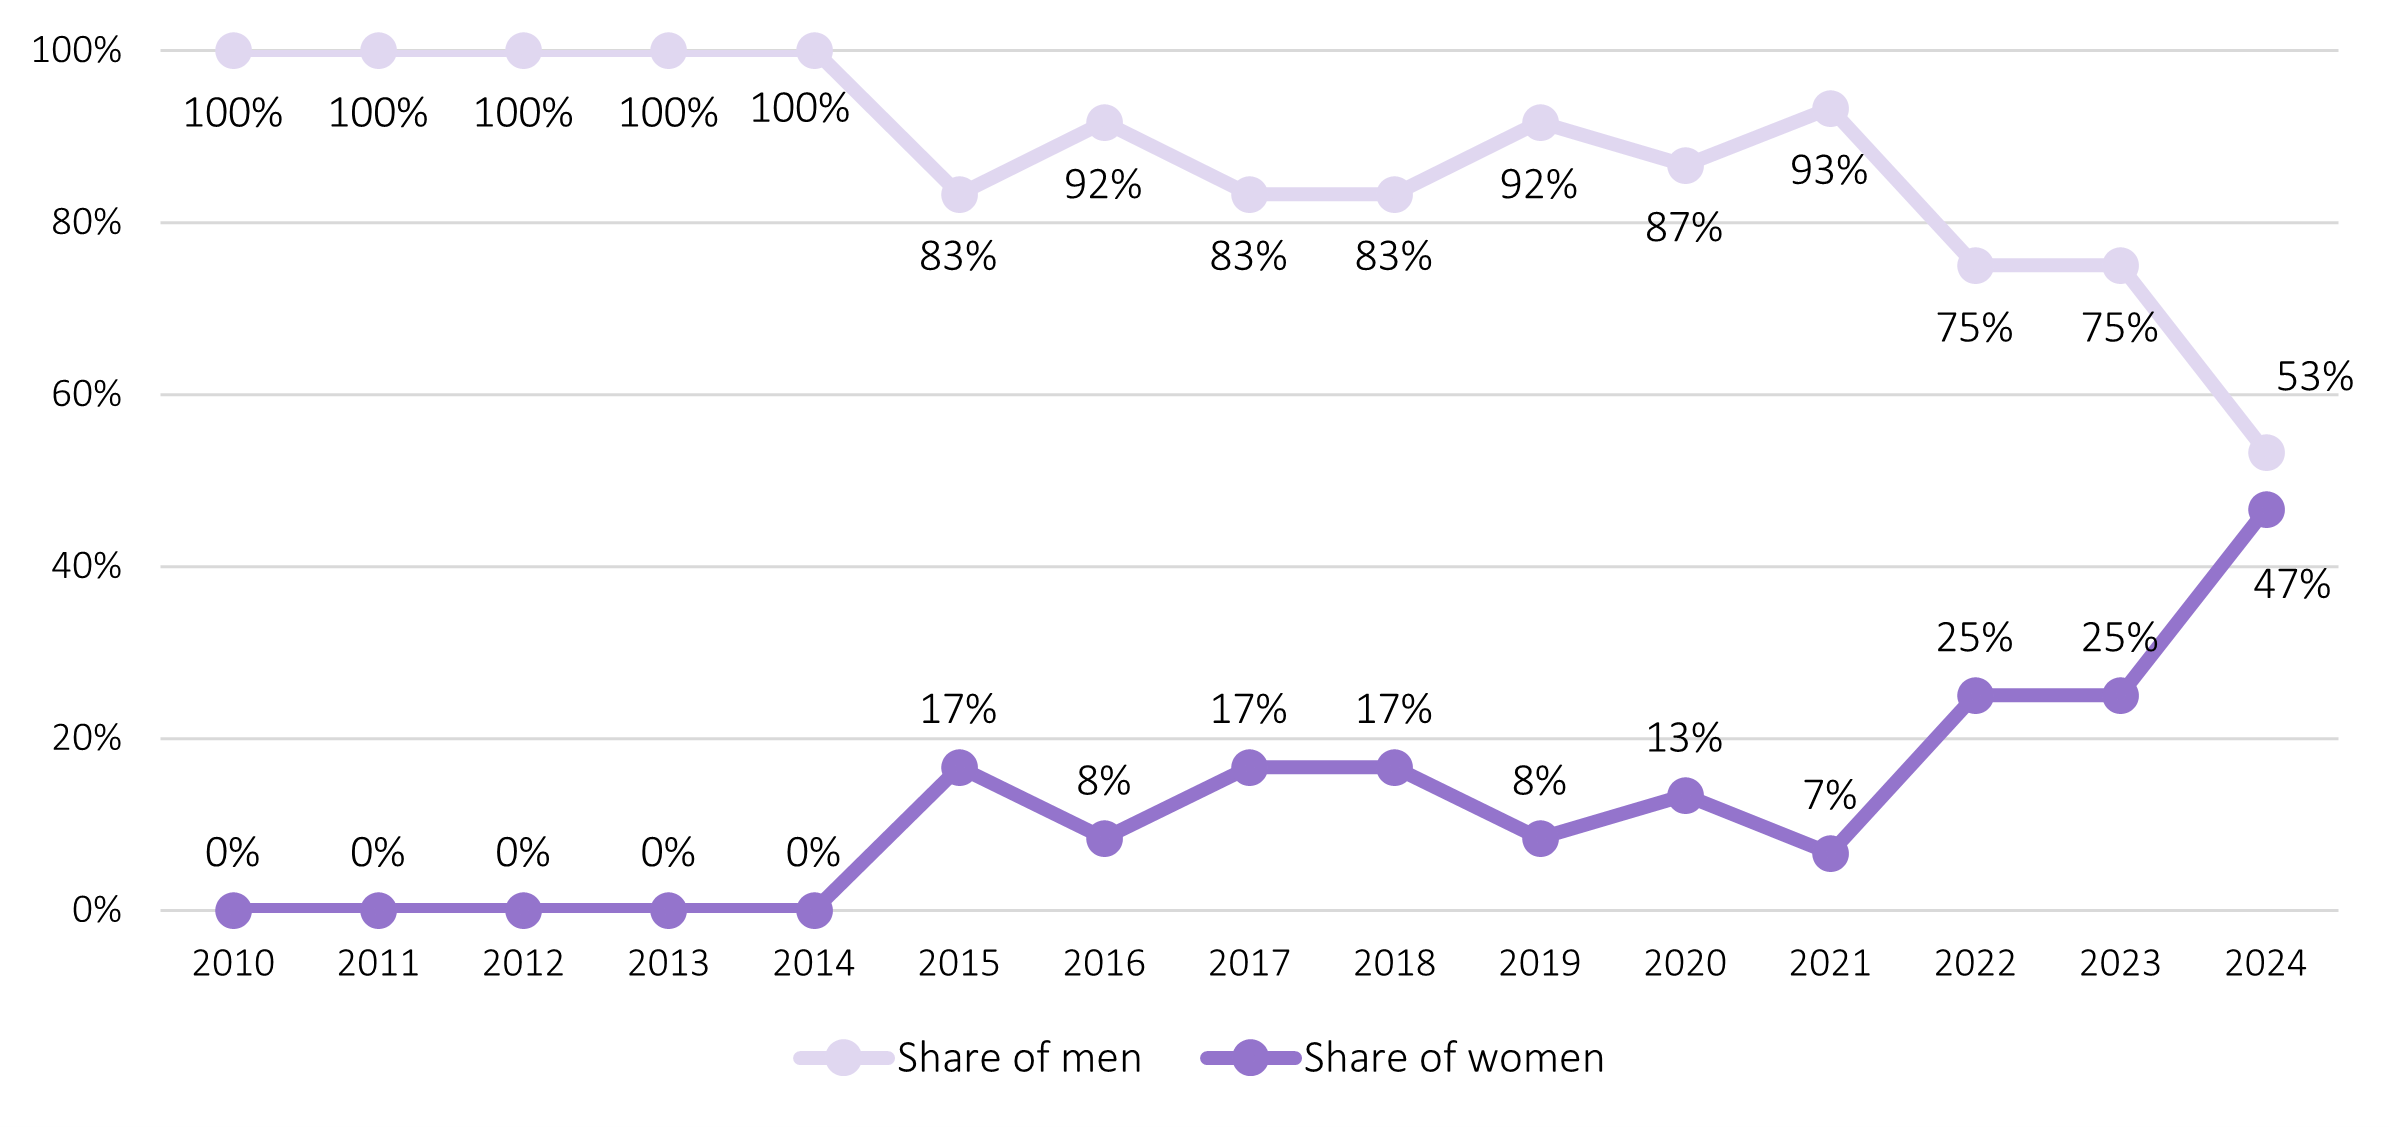
Members of Research and Development Council by gender 2010-2024.
Source: Riigi Teataja, calculations by ETAG.
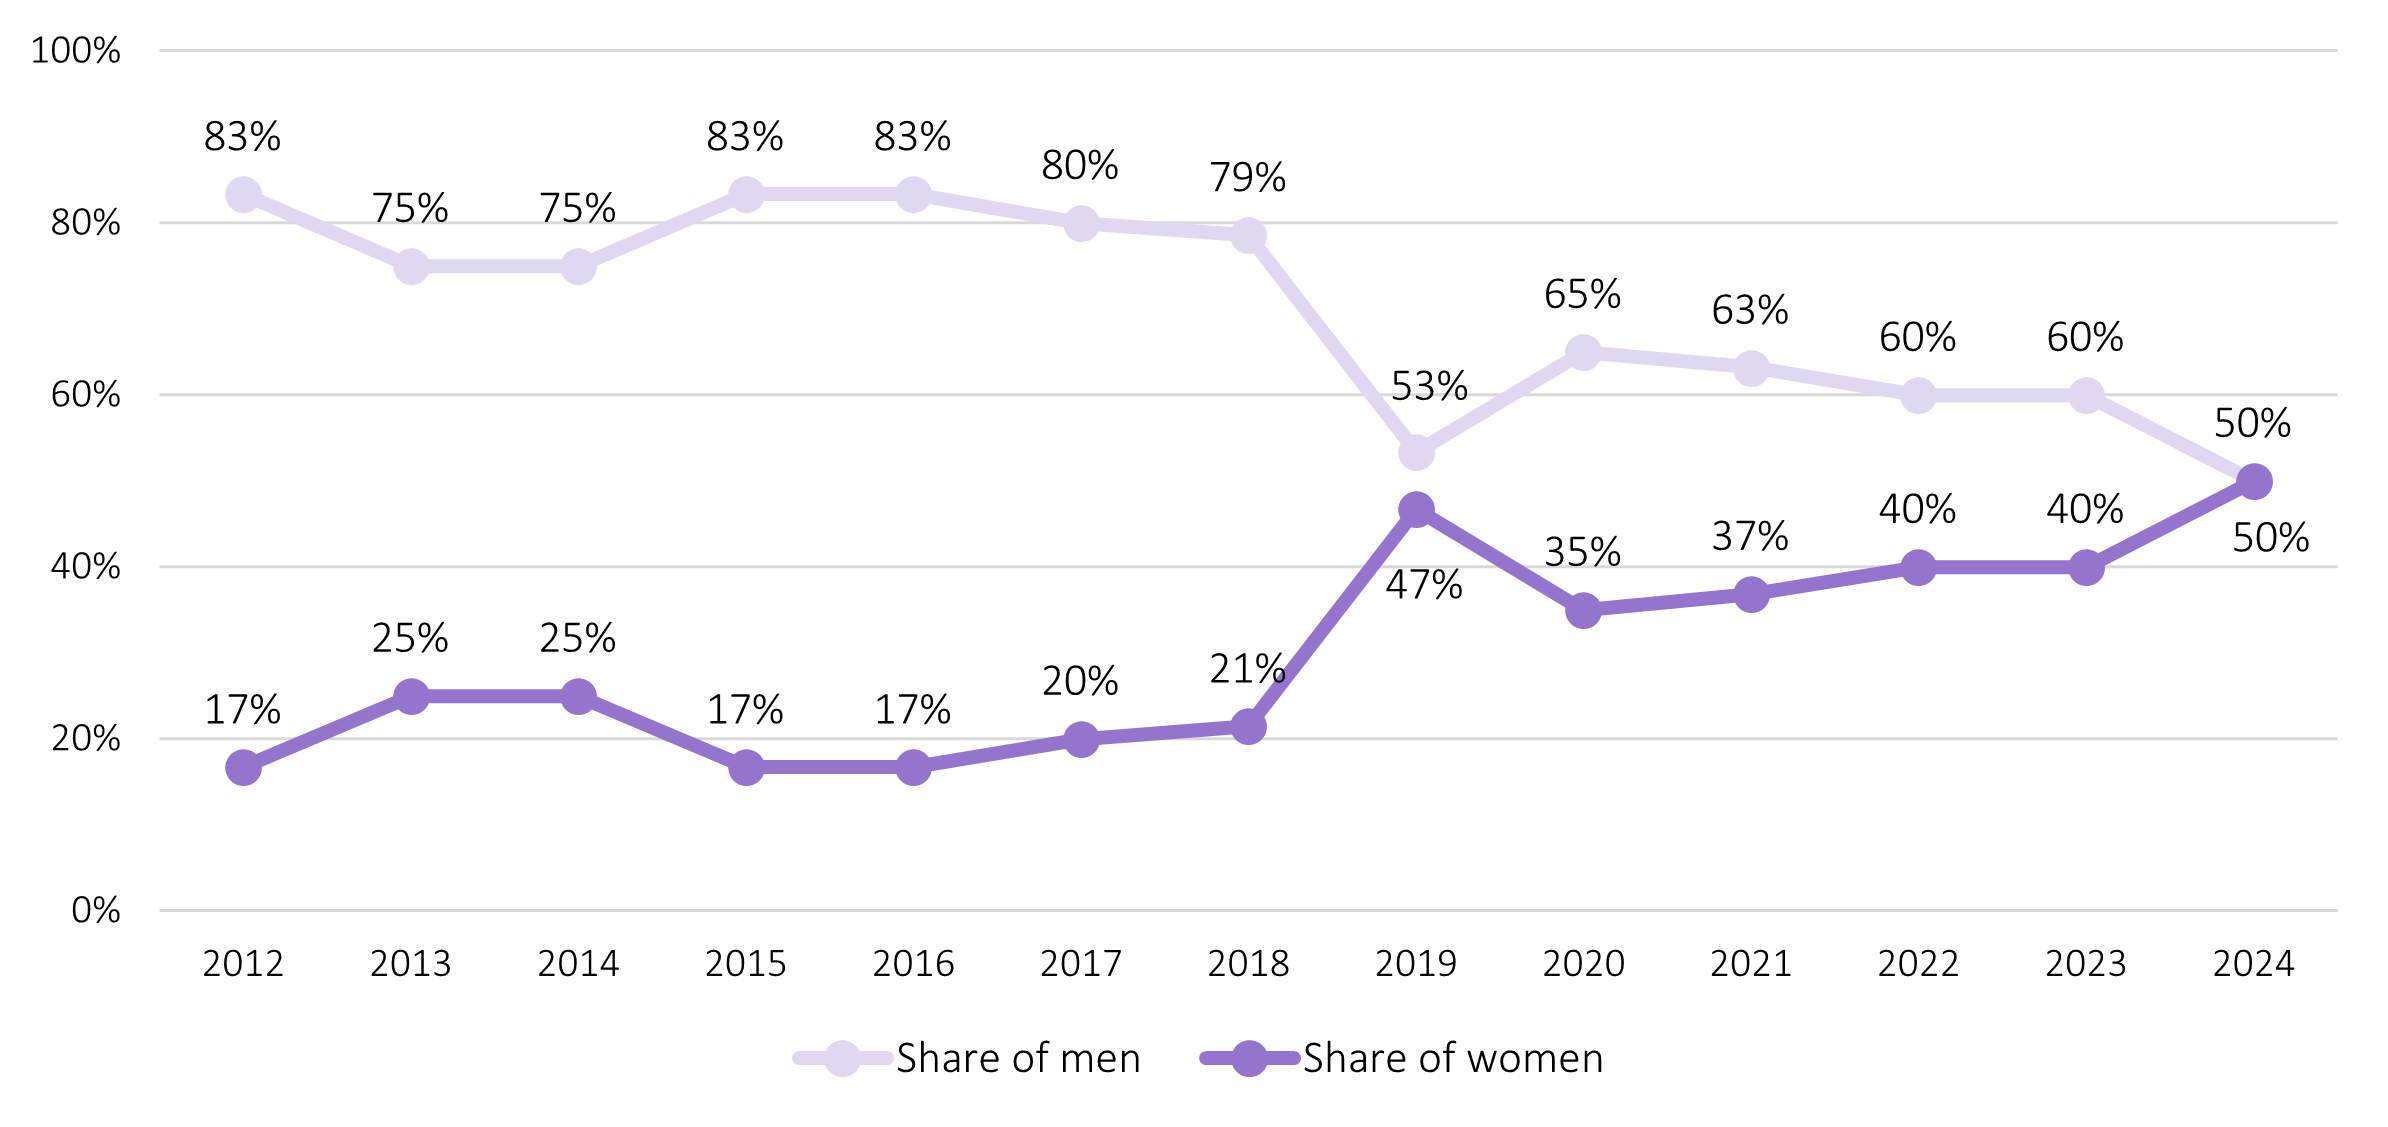
Members of the Evaluation Commitee of Estonian Research Council by gender 2012-2024.
Source: Estonian Research Council.
__
Page last updated: 27.05.2024
Contact:
| Loone Vilumaa | Marten Juurik (topic) |
| Coordinator of Research Integrity | Head of the Unit of Research Integrity |
| loone.vilumaa@etag.ee | marten.juurik@etag.ee |
| +372 731 7381 |
Additional information on gender mainstreaming is found here.